Understanding how your site performs in the real world is critical to delivering a fast, engaging experience. What actually happens when people visit? Does the page load quickly and smoothly? Without unexpected movement or interaction delays? Which pages are slowest? Are users having a good time?
Today, we’re launching Calibre RUM, which captures Core Web Vitals and key UX signals directly from real browser sessions. Now, you can see exactly where your site is fast, where it’s slow, and who is affected.
The RUM Dashboard shows live visitor counts, session totals, audience locations, and Core Web Vitals trends at a glance.
The Pages Leaderboard ranks your pages by traffic volume. You can sort by any metric (LCP, INP, CLS, or others) to find the pages with the worst user experience. Group pages by URL pattern (like /blog/* or /products/*) to see how vital sections of your site perform.
No guesswork. Start with the pages that affect the most users. Fix them, iterate.
Pages ranked by traffic volume, with Core Web Vitals scores for each.
Calibre RUM identifies the specific DOM elements responsible for slow renders (LCP), interaction delays (INP), and layout shifts (CLS). Add custom attribution with data-name or elementtiming attributes so it’s clear which element or image is causing them problem.
INP Attribution Targets identifies which interactive elements cause the longest delays.
The Audience Report shows what percentage of visitors had a good, to improve, or poor experience. It segments UX experience by page, page grouping, element, country, device type, browser, and more. You’ll see which areas are affected the most, and what’s worth investigating further.
See where user experience is strong and where it suffers, segmented by country, device, browser and more.
Calibre RUM collects no cookies, no personal data, and no IP addresses. Session identifiers live in sessionStorage and are discarded when the tab closes. The script supports signature-based subresource integrity (SSRI) to prevent supply-chain tampering, and you can optionally exclude EEA/EU visitors entirely. Learn about data collection, processing, retention, and more.
You set the session sampling rate and data retention period. Monitor at a level that matches your requirements, and budget. Sample by 15% of user sessions or 100%. Hard stop billing, or flexible, it’s up to you.
These updates reflect the addition of Real User Monitoring (RUM) to Calibre’s product suite.
Because RUM collects performance data from real visitor sessions on your website, our legal and security documentation needed to clearly describe how that data is collected, processed, stored, and protected — and what your responsibilities are as a customer deploying RUM.
We also took the opportunity to trim our sub-processor list (removals only, no new additions), and expanded our security page to reflect the full scope of our technical and organisational safeguards.
If you have questions about any of these changes, or want a copy of the revised Data Processing Agreement, contact us at privacy@calibreapp.com.
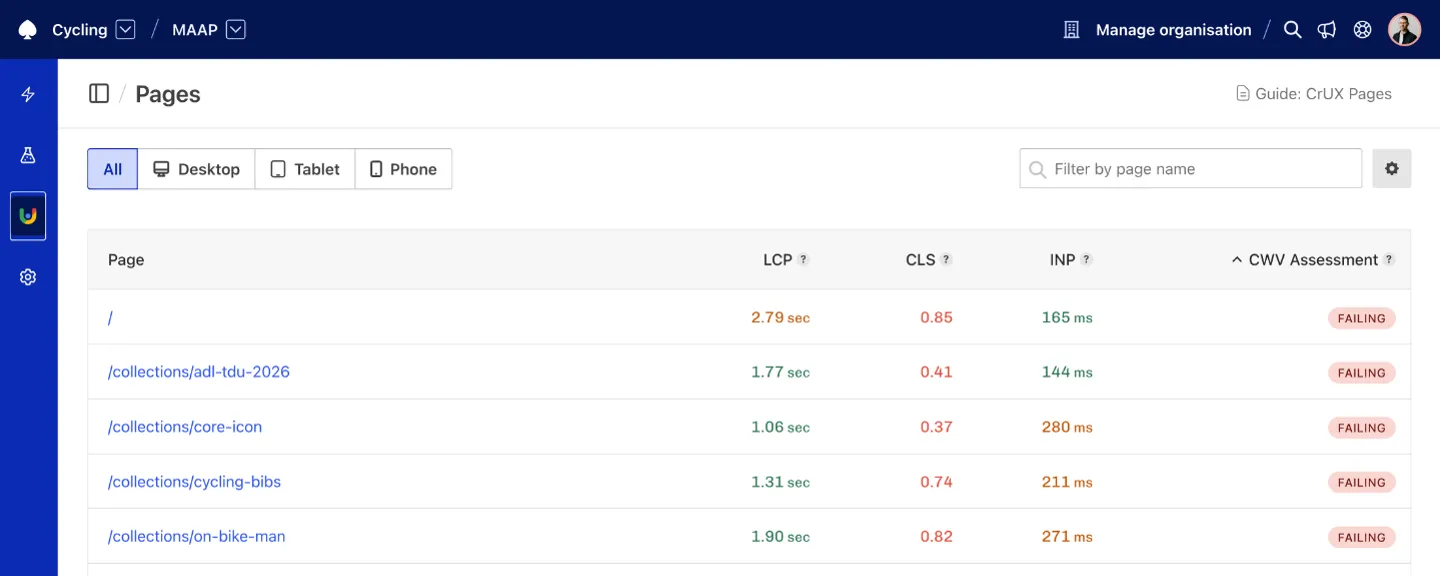
Figuring out which of your pages appear in Google’s Chrome User Experience Report (CrUX) has always meant manual work. Your site might have thousands of pages, but only a subset shows up in the CrUX dataset. Until now, identifying and tracking which URLs to monitor was on you.
Today, Calibre handles that automatically. Automatic page discovery for CrUX Pages finds the most important URLs on your site and tracks them, so you always have up-to-date, real-user performance data with zero manual setup.
Calibre discovers new pages as they're published. Here, recent "Tour Down Under" cycling event product collection page is automatically surfaced with real-user metrics only a few days after launch.
Calibre periodically spiders your website to build a map of your most important pages. We look at signals like navigation placement and internal link structure to determine which pages are most important, just like real users would when navigating your site.
Those pages are then matched against Google’s CrUX dataset. Pages with sufficient traffic to appear in CrUX are automatically tracked and kept up to date.
If a page doesn’t receive enough traffic to meet Google’s eligibility thresholds, it won’t appear in CrUX Pages. This is a limitation of the CrUX dataset itself.
Inspecting Interaction to Next Paint (INP) metric shows which Pages have the worst overall INP performance, so its easy to identify which Pages need attention most.